

How to analyze Lens Protocol activity data with Subsquid

Software Engineering, Blockchain, Basket, Science 🇮🇹🇬🇧🇫🇷 If I have seen further it is by standing on the shoulders of giants
Summary
I am showing how to quickly build an analytics web page for Lens Protocol, using Subsquid's indexing framework, and React.
Lens is a very cool project, and social media are known for generating a lot of data, which is why having an SDK to create your own custom analytics for on-chain data is super important.
The project discussed in this article is available in this repository:
github.com/RaekwonIII/lens-analytics-squid/
The repository is also configured, so you can run the project on Gitpod:

Introduction
Recently I have started publishing tutorials, using projects that I find interesting as the subject. This walkthrough is following (social media pun intended 🤓) the trend, and I chose to look into Lens Protocol, a composable and decentralized social graph for building blockchain-based social media.
This also came in handy, because Lens is deployed on Polygon, so this meant I could build a tutorial for this blockchain as well.
Lens Protocol smart contract(s)
Lens utilizes NFTs to define all interactions (Profiles, Posts, Comments, even Follows), so it was familiar territory. I started looking into the Lens Protocol Profiles token on a block explorer, but the smart contract architecture get fairly complex. The related contract is actually a Proxy for this other contract (which we are going to use later), which is called LensHub.
Luckily for me, the team Open Sourced their contracts' code in a GitHub repository, and they also structured it nicely, so I went to study it.
I'm not going to go into too much detail about this is structured (I'm not going to risk getting called out for something incorrect by the team! 😆). What was important for me is to get a general overview of how the interactions worked, and for this, the InteractionLogic.sol library was very useful. I also wanted to be able to browse all the events generated by LensHub, which I have found in the Events.sol library.
The project
The entire project is made of two main components:
a React app, to show the analytics data
a squid ETL, with a GraphQL API: the data source for the React app
React app
I started building my project, by creating a new React app, and installing the libraries I needed to render the charts I had in mind.
npx create-react-app lens-analytics-squid - template typescript
cd lens-analytics-squid
npm install - save react-chartjs-2 chart.js
For my demonstration, I wanted to build a few bar charts, showing daily statistics about profiles created, as well posts, and comments. Since I am no React expert (or frontend, for what matters), I took the react-chartjs-2 example as reference.
I went on to change the App.tsx file to look like this:
import React from 'react';
import {
Chart as ChartJS,
CategoryScale,
LinearScale,
BarElement,
Title,
Tooltip,
Legend,
} from 'chart.js';
import { Bar } from 'react-chartjs-2';
ChartJS.register(
CategoryScale,
LinearScale,
BarElement,
Title,
Tooltip,
Legend
);
export const options = {
responsive: true,
plugins: {
legend: {
position: 'top' as const,
},
title: {
display: true,
text: 'Chart.js Bar Chart',
},
},
};
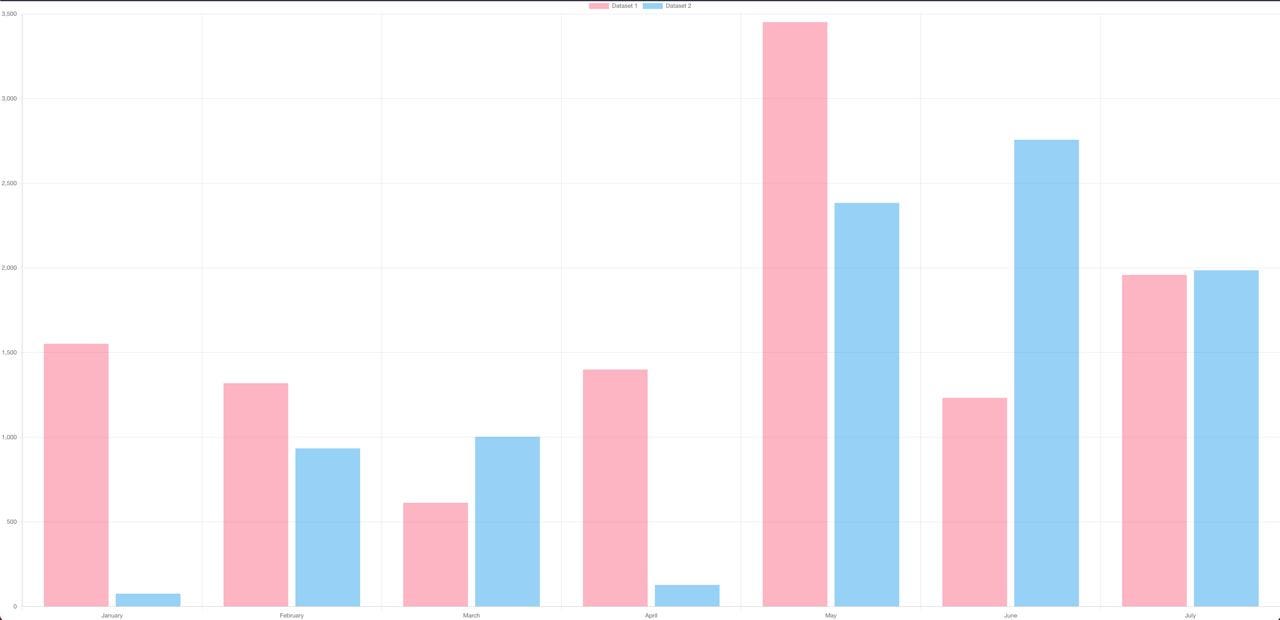
const labels = ['January', 'February', 'March', 'April', 'May', 'June', 'July'];
export const data = {
labels,
datasets: [
{
label: 'Dataset 1',
data: [1552, 1319, 613, 1400, 3452, 1233, 1959,],
backgroundColor: 'rgba(255, 99, 132, 0.5)',
},
{
label: 'Dataset 2',
data: [76, 934, 1003, 128, 2384, 2757, 1986, ],
backgroundColor: 'rgba(53, 162, 235, 0.5)',
},
],
};
export function App() {
return <Bar options={options} data={data} />;
}
Then started the server:
npm start
And here is my static bar chart:
Squid ETL
Next, in order to make my chart dynamic and show real data, I created a new squid project. Because Polygon is an EVM chain, just like Ethereum, I chose the evm template.
Note: I chose to create this as a sub-folder of the React app, out of convenience, to have everything in one single repository, but this is not mandatory.
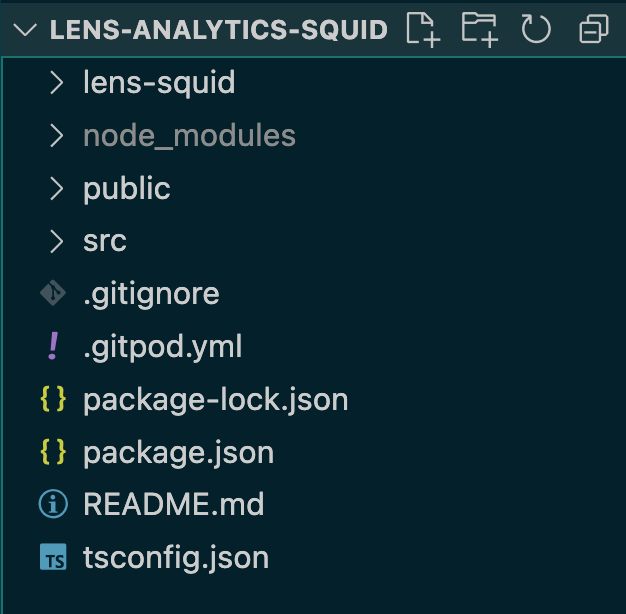
sqd init lens-squid -t evm
Our project should look like this by now (except for .gitpod.yml, I just added this at the end, to allow everyone to launch the project on Gitpod):
Schema
I wanted to index Profiles, Posts (which Lens calls publications), and Comments on the protocol. So I chose this schema, for my database and my GraphQL API:
type Profile @entity {
  id: ID!
  address: String @index
  handle: String @index
  imageURI: String
  profileId: Int!
  posts: [Post!] @derivedFrom(field: "creatorProfile")
  comments: [Comment!] @derivedFrom(field: "profile")
  mirrors: [Mirror!] @derivedFrom(field: "profile")
  timestamp: DateTime! @index
}

type Post @entity {
  id: ID!
  contentURI: String
  postId: Int!
  profileId: Int!
  mirrors: [Mirror!] @derivedFrom(field: "originalPost")
  creatorProfile: Profile! @index
  timestamp: DateTime! @index
}

type Comment @entity {
  id: ID!
  contentURI: String!
  commentId: Int!
  profileId: Int!
  profile: Profile! @index
  originalPostId: Int!
  originalPost: Post!
  originalProfileId: Int!
  originalProfile: Profile! @index
  timestamp: DateTime! @index
}
Note: I also wanted to experiment with the equivalent of "re-post" and "like" actions, which are called
MirrorandCollect, respectively, even though, for the moment I am not using these.
If I end up adding these to the project, I'll update the article.
Thanks to Subsquid's SDK, it's possible to automatically generate TypeScript models for these types, and use them in our code. It's only necessary to run this command in the squid's root folder:
sqd codegen
ABI code-bindings
The next step was importing the ABI into the project, so I copied it from the Contract's page on the block explorer
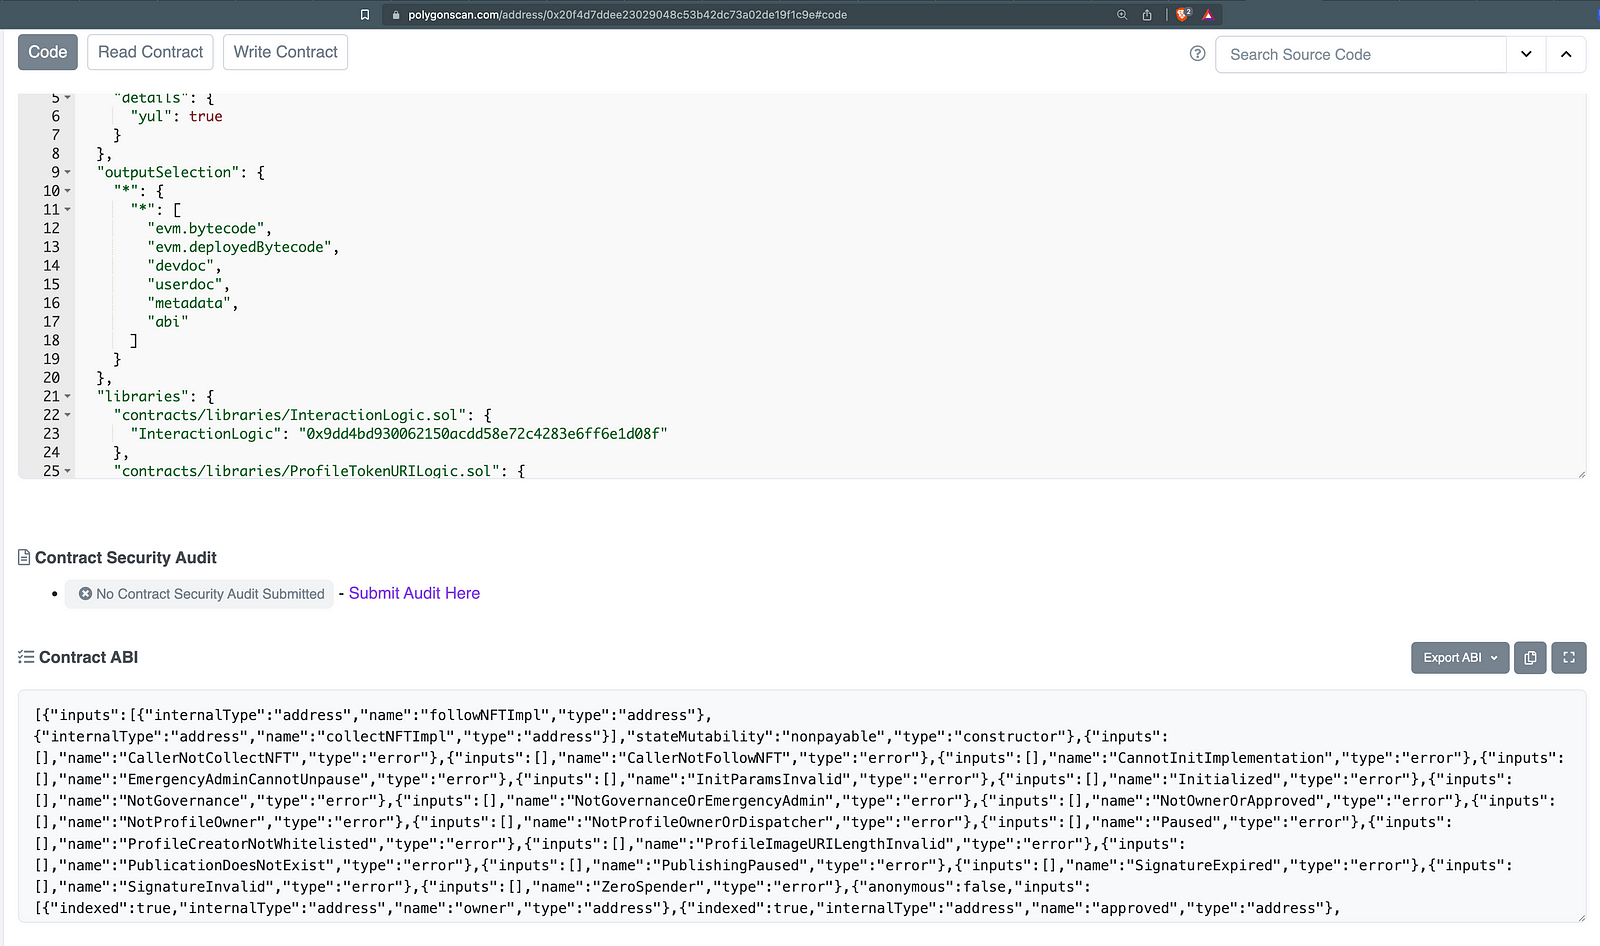
I then pasted the content in a file named lens-abi.json in my lens-squid folder, and generated TypeScript boilerplate code to interact with it, thanks to Subsquid's CLI command:
sqd typegen lens-abi.json
Here comes the tricky part: I wanted to do the same thing for the Events.sol library, but I did not have its ABI, so I cloned the repo, installed the dependencies, and used truffle to compile it for me.
You can avoid doing that, by directly downloading the Events.json file from the repository of this project.
If you really want to do it by yourself or are just simply curious, here are the commands I ran:
git clone git@github.com:lens-protocol/core.git
npm i
npm i @openzeppelin/contracts
truffle compile
If you can't do it, maybe you need to add a truffle.config.js file, with the configuration for the right Solidity compiler version:
module.exports = {
  networks: {
    development: {
      host: '127.0.0.1',
      port: 8545,
      network_id: '1337',
    },
  },
  mocha: {
    // timeout: 100000
  },
  compilers: {
    solc: {
      version: '0.8.10',
    },
  },
};
With the Events.json ABI in my project, I was able to run this command, and generate TypeScript wrappers for all the events related to Lens Protocol;
sqd typegen Events.json
Data processing
For my data processing part, I tried to keep it relatively simple. Here is a list of functionalities that need to be accomplished, and some code snippets to showcase how they are implemented:
- configure the indexer to extract data generated by the LensHub smart contract and filter for the three events I am interested in:
ProfileCreated,PostCreated,CommentCreated
const lensContractAddress =
  "0xDb46d1Dc155634FbC732f92E853b10B288AD5a1d".toLowerCase();

const processor = new EvmBatchProcessor()
  .setDataSource({
    archive: lookupArchive("polygon"),
  })
  .addLog(lensContractAddress, {
    filter: [
      [
        events.ProfileCreated.topic,
        events.PostCreated.topic,
        events.CommentCreated.topic,
      ],
    ],
    data: {
      evmLog: {
        topics: true,
        data: true,
      },
      transaction: {
        hash: true,
      },
    },
  });
- Process the batch of mixed events that Subsquid Archive provides to my processor at recurring intervals and sort out the different event kinds, decode them separately, and store the decoded data in temporary data interface arrays
type ProfileCreated = {
  handle: string;
  imageURI: string;
  profileId: number;
  to: string;
  timestamp: Date;
};

processor.run(new TypeormDatabase(), async (ctx) => {
  const profiles: ProfileCreated[] = [];

  for (let c of ctx.blocks) {
    for (let i of c.items) {
      if (i.address === lensContractAddress && i.kind === "evmLog") {
        if (i.evmLog.topics[0] === events.ProfileCreated.topic) {
          const { handle, imageURI, profileId, to, timestamp } =
            events.ProfileCreated.decode(i.evmLog);
          profiles.push({
            handle,
            imageURI,
            profileId: profileId.toNumber(),
            to,
            timestamp: new Date(timestamp.toNumber() * 1000),
          });
        }
        // ... similar thing for PostCreated and CommentCreated events
      }
    }
  }
  // need to save the data here
});
- Process the temporary data interface and do some cross-checking on the data (e.g.: check that when a
Commentis being created, thePostit refers to already exists…)
async function saveLensData(
  ctx: BlockHandlerContext<Store>,
  profiles: ProfileCreated[],
  posts: PostCreated[],
  comments: CommentCreated[],
) {
  const profileIds: Set<number> = new Set();

  for (const profile of profiles) {
    profileIds.add(profile.profileId);
  }

  const profileModels: Map<string, Profile> = new Map(
    (await ctx.store.findBy(Profile, { id: In([...profileIds]) })).map(
      (profile) => [profile.profileId.toString(), profile]
    )
  );

  for (const profile of profiles) {
    const { handle, imageURI, profileId, timestamp, to } = profile;
    let profileModel = profileModels.get(profileId.toString());
    if (profileModel == null) {
      profileModel = new Profile({
        id: profileId.toString(),
        profileId,
        timestamp,
      });
      profileModel.address = to;
      profileModel.handle = handle;
      profileModel.imageURI = imageURI;
      profileModels.set(profileModel.profileId.toString(), profileModel);
    }
  }

  // same kind of processing for Post and Comment, only slightly more comples
  // because when processing a Post, we need to verify existence of Profile

  // similarly, for comments, the existence of related Post and Profile(s)
  // need to be verified as well

  await ctx.store.save([...profileModels.values()]);
}
All the logic is defined in the processor.ts file, under lens-squid/src and you can inspect it in the GitHub repository.
Data aggregation
The data processing implemented so far made sure I saved all the Profiles, Posts, Comments, but what if I wanted to do some aggregations? I set my goal on creating daily totals for these type of activities, so I need this kind of data.
Luckily, it's a common pattern offered by GraphQL servers, to write your own custom resolver as a server extension, and specify custom queries. I set on to create an index.ts file under the src/server-extension/resolvers and I built my own daily aggregations using simple SQL queries.
Here is an example for the number of Profiles created on a daily on Lens Protocol
//lens-squid/src/server-extension/resolvers/index.ts
import 'reflect-metadata'
import type { EntityManager } from 'typeorm'
import { Field, ObjectType, Query, Resolver } from 'type-graphql'
import { Profile, Post, Comment } from '../../model'

@ObjectType()
export class ProfilesDayData {
    @Field(() => Date, { nullable: false })
    day!: Date

    @Field(() => Number, {nullable: false})
    count!: number

    constructor(props: Partial<ProfilesDayData>) {
        Object.assign(this, props)
    }
}

@Resolver()
export class ProfilesDayDataResolver {
    constructor(private tx: () => Promise<EntityManager>) {}

    @Query(()=>[ProfilesDayData])
    async getProfilesDayData(): Promise<ProfilesDayData[]> {
        const manager = await this.tx()
        const repository = manager.getRepository(Profile)

        const data: {
            day: string
            count: number
        }[] = await repository.query(`
            SELECT DATE(timestamp) AS day, COUNT(*) as count
            FROM profile
            GROUP BY day
            ORDER BY day ASC
        `)
        return data.map(
            (i) => new ProfilesDayData({
                day: new Date(i.day),
                count: i.count
            })
        )
    }
}
I simply repeated the same pattern for Post(s) and Comment(s), if you want to inspect the code, it's available on GitHub.
Bear in mind, TypeScript being TypeScript, and needing types, I had to install a new library for this to work properly:
npm i type-graphql
Dynamic data in React charts
The final touch was going back to my React app, perform API requests to the squid GraphQL API, and use this data to feed the chart on the page.
- I used React's
useStateanduseEffectto, respectively, set the bar chart data as my App's state, and to change it, by performing this GraphQL query.
query MyQuery {
    profilesConnection(orderBy: id_ASC) {
      totalCount
    }
    postsConnection(orderBy: id_ASC) {
      totalCount
    }
    commentsConnection(orderBy: id_ASC) {
      totalCount
    }
    getCommentDayData {
      count
      day
    }
    getPostDayData {
      count
      day
    }
    getProfilesDayData {
      count
      day
    }
  }
Made sure the App returns a placeholder title, if the state is not set (e.g.: the API fails, for some reason)
Because I have three different time series, and I wanted to test how all three of them looked in a single bar chart (spoiler: not very good 🙁), I had to write a bit of code to "synchronize" the different datasets.
Finally, I have changed App's
returnstatement to display four different bar charts, with different datasets, instead of one.
Here's the end result:
// src/App.tsx
import React from "react";
import {
Chart as ChartJS,
CategoryScale,
LinearScale,
BarElement,
Title,
Tooltip,
Legend,
} from "chart.js";
import { Bar } from "react-chartjs-2";
import axios from "axios";
ChartJS.register(
CategoryScale,
LinearScale,
BarElement,
Title,
Tooltip,
Legend
);
export const barChartOptions = {
responsive: true,
plugins: {
legend: {
position: "top" as const,
},
title: {
display: false,
text: "Daily Analytics",
},
},
};
const headers = {
"content-type": "application/json",
};
const requestBody = {
query: `query MyQuery {
profilesConnection(orderBy: id_ASC) {
totalCount
}
postsConnection(orderBy: id_ASC) {
totalCount
}
commentsConnection(orderBy: id_ASC) {
totalCount
}
getCommentDayData {
count
day
}
getPostDayData {
count
day
}
getProfilesDayData {
count
day
}
}
`,
};
const graphQLOptions = {
method: "POST",
url: "http://localhost:4350/graphql",
headers,
data: requestBody,
};
type DataInterface = {
labels: string[];
datasets: {
label: string;
data: number[];
backgroundColor: string;
}[];
};
export function App() {
const [barChartData, setBarChartData] = React.useState<DataInterface | null>(
null
);
React.useEffect(() => {
try {
axios(graphQLOptions).then((response) => {
let labelsSet: Set<string> = new Set([
...response.data.data.getProfilesDayData.map((obj: any) => obj.day),
...response.data.data.getPostDayData.map((obj: any) => obj.day),
...response.data.data.getCommentDayData.map((obj: any) => obj.day),
]);
let profileDataMap: Map<string, number> = new Map<string, number>();
let postDataMap: Map<string, number> = new Map<string, number>();
let commentDataMap: Map<string, number> = new Map<string, number>();
for (const date of labelsSet) {
profileDataMap.set(
date,
response.data.data.getProfilesDayData.find(
(obj: any) => obj.day === date
)?.count || 0
);
postDataMap.set(
date,
response.data.data.getPostDayData.find(
(obj: any) => obj.day === date
)?.count || 0
);
commentDataMap.set(
date,
response.data.data.getCommentDayData.find(
(obj: any) => obj.day === date
)?.count || 0
);
}
console.log([...profileDataMap.values()]);
setBarChartData({
labels: [...labelsSet].map((dateString) =>
new Date(dateString).toLocaleDateString()
),
datasets: [
{
label: "Daily Profiles created",
data: [...profileDataMap.values()],
backgroundColor: "rgba(255, 99, 132, 0.5)",
},
{
label: "Daily Posts created",
data: [...postDataMap.values()],
backgroundColor: "rgba(53, 162, 235, 0.5)",
},
{
label: "Daily Comments created",
data: [...commentDataMap.values()],
backgroundColor: "rgba(20, 255, 235, 0.5)",
},
],
});
});
} catch (err) {
console.log("ERROR DURING AXIOS REQUEST", err);
}
}, []);
if (!barChartData) return <h1>"No data 🤷♂️!"</h1>;
const profileBarChartData = {
labels: barChartData.labels,
datasets: [barChartData.datasets[0]],
};
const postsBarChartData = {
labels: barChartData.labels,
datasets: [barChartData.datasets[1]],
};
const commentsBarChartData = {
labels: barChartData.labels,
datasets: [barChartData.datasets[2]],
};
return (
<div>
<Bar options={barChartOptions} data={profileBarChartData} />
<Bar options={barChartOptions} data={postsBarChartData} />
<Bar options={barChartOptions} data={commentsBarChartData} />
<Bar options={barChartOptions} data={barChartData} />
</div>
);
}
Testing it out
I had previously started the local server, and thanks to React's hot reloading, the changes in the paragraph above are almost instantly taken into account, so the browser page of http://localhost:3000 should now look like this:
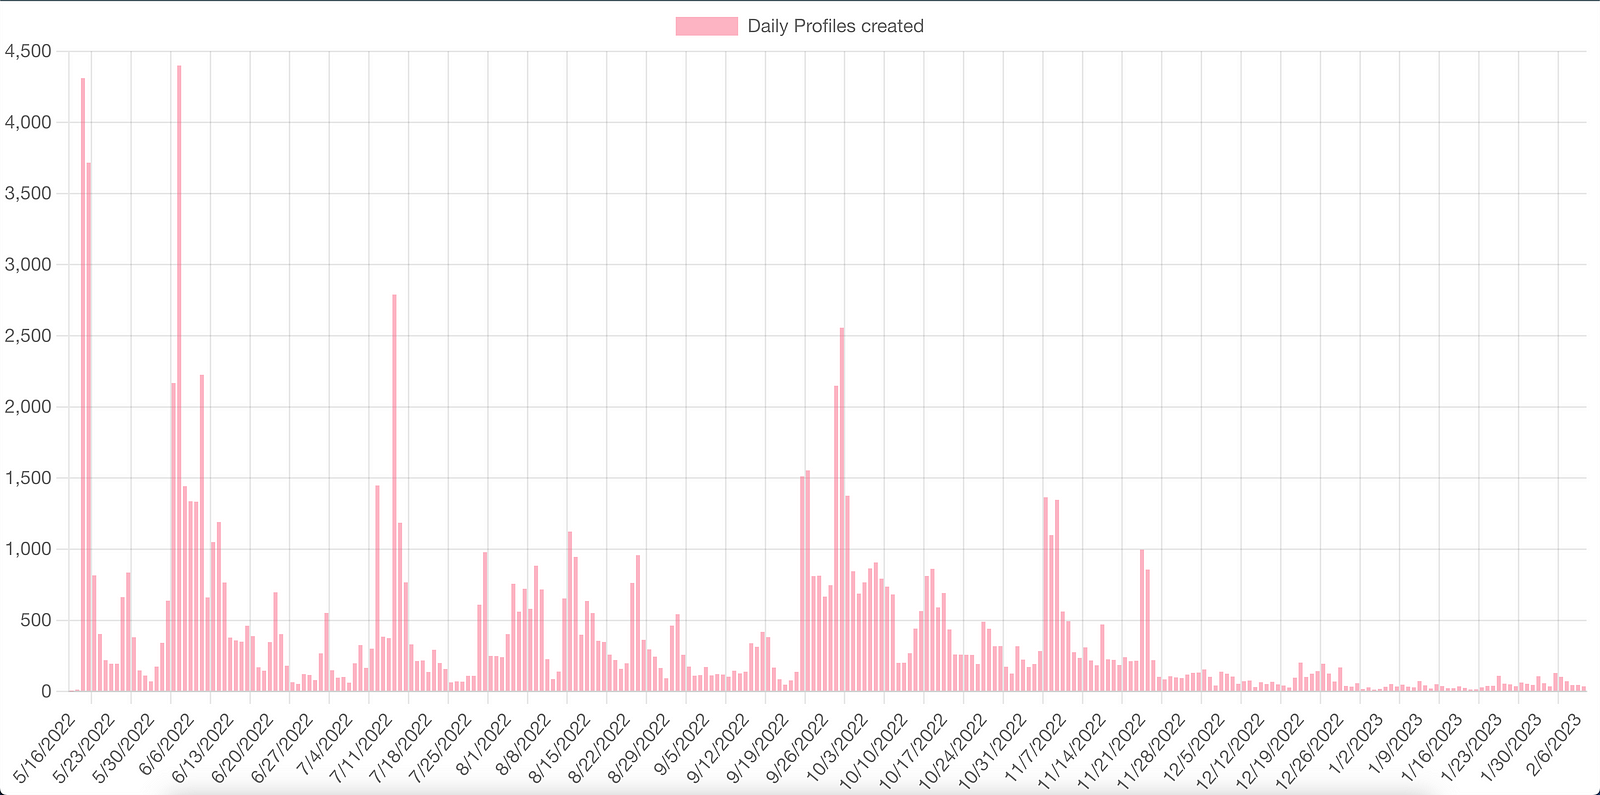
And scrolling down, there should be a similar chart for Daily Posts and Daily Comments as well. The last bar chart on the page contains data for all three datasets
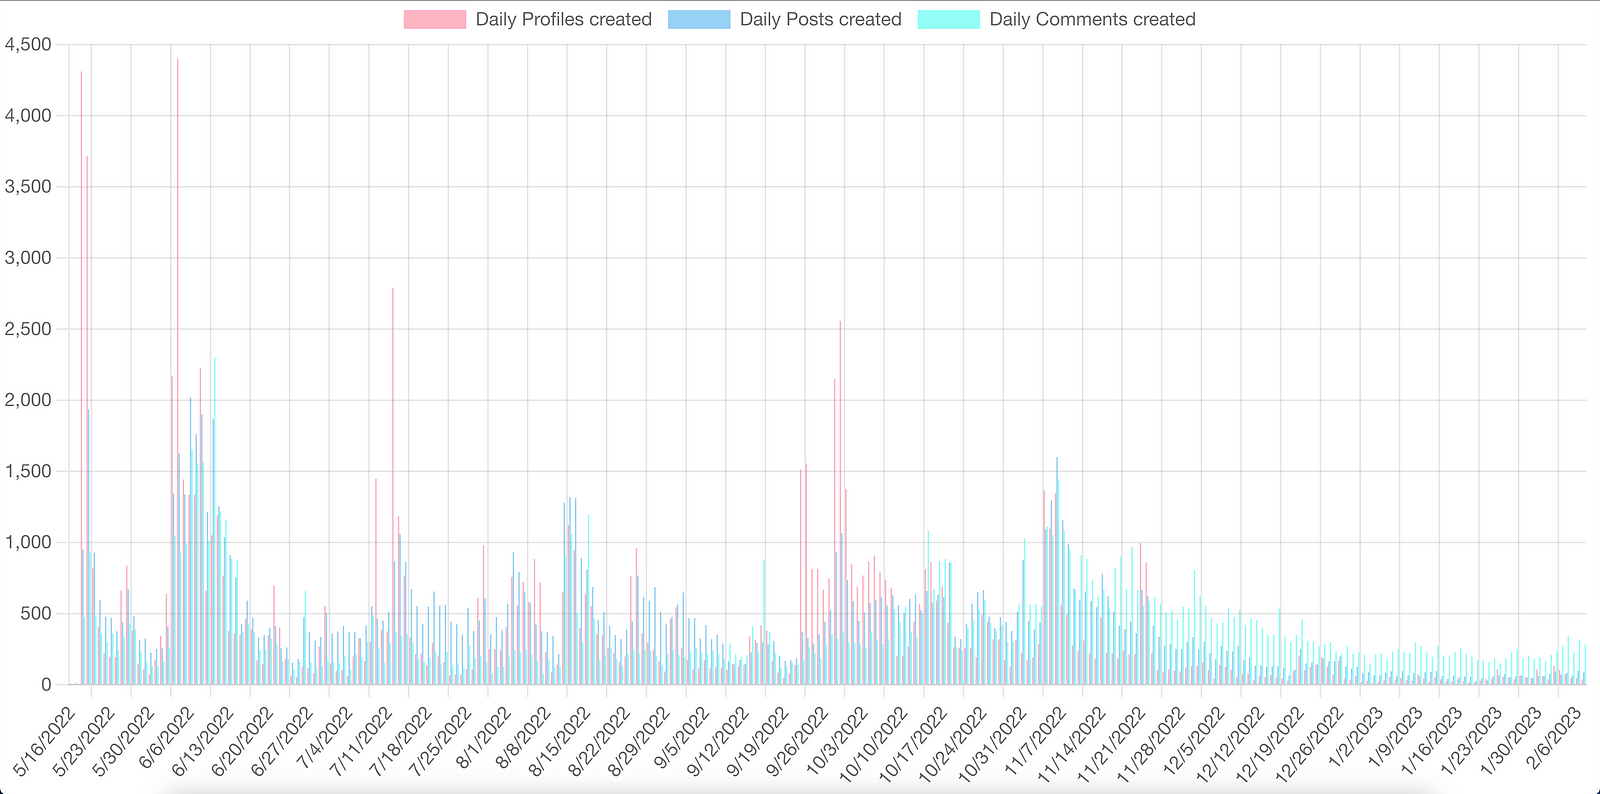
As I previously mentioned, I was expecting it to be more informative… 😅
Note: I have also added queries for totals for
Profiles,Posts,Comments, even though I have not added them to the page yet.
Once again, when I'll eventually add these to the project, this part of the article will be edited…or you can come up with your own suggestions for this and create a Pull Request to the repository 😉
Conclusions
Like I said in the introduction of the article, I think that Lens Protocol is a super interesting project, one I hope will prove to be successful.
Social media generate immense amounts of data and especially given the relative complexity of Lens' smart contract, I found out pretty quickly that cookie-cutter data solutions might not be enough.
In my opinion, considering we are so early in the blockchain industry and complex applications like Lens are only getting started, this is why having an SDK to create your own custom analytics for on-chain data is super important.
Furthermore, given how easy it has been to create my own mini-project, especially for someone with a very limited experience with React, I wanted to let web3 developers know that this is a possibility, and most importantly, provide them with a walkthrough on how to quickly build an analytics web page for Lens Protocol, using Subsquid’s indexing framework, and React.
If you found this article interesting, and you want to read more, please follow me and most importantly, Subsquid.
Subsquid socials: Website | Twitter | Discord | LinkedIn | Telegram | GitHub | YouTube


