

How to upgrade blockchain data analysis with file store indexing

Software Engineering, Blockchain, Basket, Science 🇮🇹🇬🇧🇫🇷 If I have seen further it is by standing on the shoulders of giants
Summary
In this article, I describe how to use Subsquid’s indexing framework for data analytics prototyping.
I have built an indexer that processes MATIC transactions on Ethereum mainnet, and dumps them on local CSV files.
I have then developed a simple Python script to demonstrate how to import these CSVs into a Pandas DataFrame, and perform aggregation operations on this data.
The project discussed in this article is available at this repository:
github.com/RaekwonIII/local-csv-indexing
The repository is also configured, so you can run the project on Gitpod:

Introduction
Both Python and CSV files are the bread and butter of data analysts, especially in the early prototyping stages, when trying to validate a hypothesis or get some inspiration from raw data.
This is why it's so important to have a blockchain data framework with the flexibility to allow data analysts to save data to CSV files, in order to play with this data with the tools they are already familiar with.
Luckily, Subsquid has recently released a package to do just that.
While working on a different project, I stumbled across the necessity to index transfers of an ERC20 token, and I thought this was the perfect opportunity to showcase this new feature of the SDK.
Project setup
I started by creating a new squid ETL (if you haven’t already, you need to install Subsquid CLI first), so in a terminal, I launched the command:
sqd init local-csv-indexing -t evm
Where local-csv-indexing is the name I decided to give to my project, you can change it to anything you like. And -t evm specifies what template should be used and makes sure the setup will create a project from the EVM-indexing template.
Note: The template actually has more than what we need for this project. In the repository used for this article, I went on and removed unnecessary packages, so you can use this package.json.
I have also shortened the list of available commands and removed
docker-compoes.yml,schema.graphql, andsquid.yaml, because we will not be using them.
ERC-20 token ABI
To be able to index the transfers of a token, I needed the token's address, as well as the smart contract's ABI (Abstract Binary Interface), which defines the contract's functions, the events, as well as their inputs and outputs, and their types.
Luckily, both of these can be found on block explorers like Etherscan, so I searched for MATIC's token on the website, and landed on its page.
The indexer needs the ABI, because that's how it can decode the contract's events or functions inputs (and outputs), and provide the information they carry. The SDK has a handy command to generate some boilerplate TypeScript code to achieve this.
sqd typegen 0x7D1AfA7B718fb893dB30A3aBc0Cfc608AaCfeBB0#matic
To be fair, because the contract is deployed on Ethereum, and available through Etherscan API, the SDK is able to generate the necessary code with just the smart contract address.
For all other cases, the same command needs the path to a JSON file containing the smart contract's ABI, instead of its address.
This will generate some files under the src/abi folder, the most interesting of which is matic.ts.
CSV, Tables and Databases
I then installed the file-store-csv package, because my goal was to save my data on CSV files locally, and this package is not available by default:
npm i @subsquid/file-store-csv
Equivalent packages for parquet files, and for uploading files using S3-compatible APIs are also available
Next, I created a new file, which I named tables.ts, in case I wanted to expand to multiple files. This is where I provided a filename for the CSV files, and configured their data structure, the same way as if they were a database table (the class name is no coincidence):
import {Table, Column, Types} from '@subsquid/file-store-csv'

export const Transfers = new Table(
    'transfers.csv',
    {
        blockNumber: Column(Types.Integer()),
        timestamp: Column(Types.DateTime()),
        contractAddress: Column(Types.String()),
        from: Column(Types.String()),
        to: Column(Types.String()),
        amount: Column(Types.Decimal()),
    },
    {
        header: false,
    }
)
I then created another file, which I named db.ts, to configure my data abstraction layer. This class is called Database, and it's on purpose because it provides a transparent interface to the processor, which is consistent with how the ETL usually saves data on PostgreSQL, or any future data storage.
import {Database, LocalDest, Store} from '@subsquid/file-store'
import { Transfers } from './tables'


export const db = new Database({
    tables: {
        Transfers,
    },
    dest: new LocalDest('./data'),
    chunkSizeMb: 100,
    syncIntervalBlocks: 10000
})
Note: the
chunkSizeMbconfiguration defines the size (in MB) of a CSV file before it's saved on disk, and a new one is created.Similarly, the
syncIntervalBlocksconfiguration defines how many blocks have to be ingested, before creating a new CSV file, when the indexing process has reached the blockchain's head and is in sync with it.
Data indexing
All the indexing logic is defined in the file named processor.ts, so I opened it, and edited the EvmBatchProcessor class configuration, to request data for the right smart contract, and the right EVM log:
export const contractAddress =
  "0x7D1AfA7B718fb893dB30A3aBc0Cfc608AaCfeBB0".toLowerCase();

const processor = new EvmBatchProcessor()
  .setDataSource({
    archive: lookupArchive("eth-mainnet"),
    chain: process.env.RPC_ENDPOINT,
  })
  .addLog(contractAddress, {
    filter: [[events.Transfer.topic]],
    data: {
      evmLog: {
        topics: true,
        data: true,
      },
    } as const,
  });
Note: I used the
RPC_ENDPOINTenvironment variable, make sure to edit the.envfile and use a valid url of an Ethereum RPC node.
I then defined the logic to process a batch of EVM log data, and save it in the CSV files.
I run a double loop to explore all the blocks in each batch, and the items in each block. In the innermost loop, I check that the items are actually EVM logs (this check favors TypeScript typings, as different kinds of items have access to different fields), that they have been generated by the right address and that they have the right topic signature.
I then decode the event and prepare an object with the right data structure, which I add to an array.
Outside both loops, I perform a single operation to save all the objects in the array I have prepared. This batch operation helps by increasing the overall performance.
Here is a short summary of the logic:
processor.run(db, async (ctx) => {
  const transfers: Record[] = [];
  let decimals = 18;
  for (let block of ctx.blocks) {
    for (let item of block.items) {
      if (item.address !== contractAddress) continue;
      if (item.kind !== "evmLog") continue;
      if (item.evmLog.topics[0] !== events.Transfer.topic) continue;

      const { from, to, value } = events.Transfer.decode(item.evmLog);
      transfers.push({
        blockNumber: block.header.height,
        timestamp: new Date(block.header.timestamp),
        contractAddress: item.address,
        from: from.toLowerCase(),
        to: to.toLowerCase(),
        amount: BigDecimal(value.toBigInt(), decimals).toNumber(),
      });
    }
  }

  ctx.store.Transfers.writeMany(transfers);
});
But I suggest taking a look at the file on the GitHub repository, as there's some added logic to obtain the number of decimals for the token, using Subsquid's SDK to interact with the smart contract deployed on chain (this is where the RPC_ENDPOINT variable is being used).
To launch the project, simply open a terminal and run this command:
sqd process
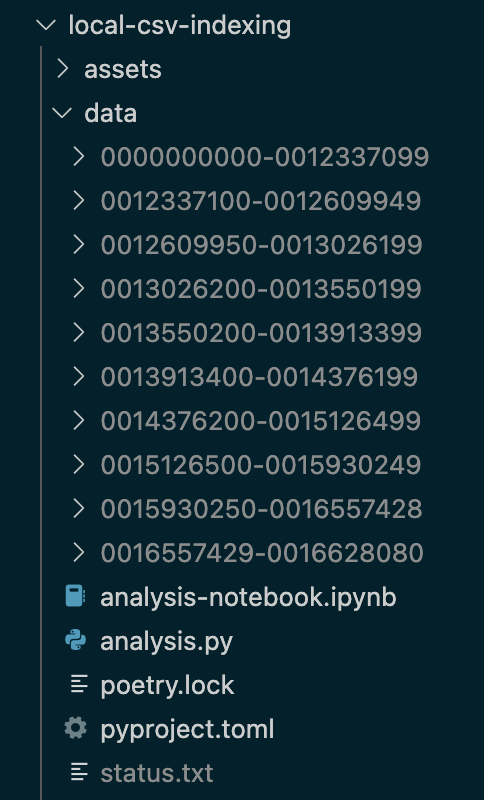
And in a few minutes, you should have a few sub-folders (whose names are the block ranges where the data is coming from) under the data directory, each containing a transfer.csv file.
Data analysis with Python
Python is a very intuitive and idiomatic language and as I mentioned at the beginning of the article, Pandas is pretty much the preferred choice for data analysts.
I didn't want to turn this article into a "Pandas for data analytics" tutorial, so I kept this part voluntarily short and simple.
The purpose is simply to demonstrate that locally analyzing blockchain data, with Pandas and CSV files is possible, and briefly show how.
This being said, I set on to ingest the data from the various CSVs into a single DataFrame, perform some data operations, like converting the string timestamp column into a datetime column, and sort the DataFrame (this was purely for some manual data inspection and exploration).
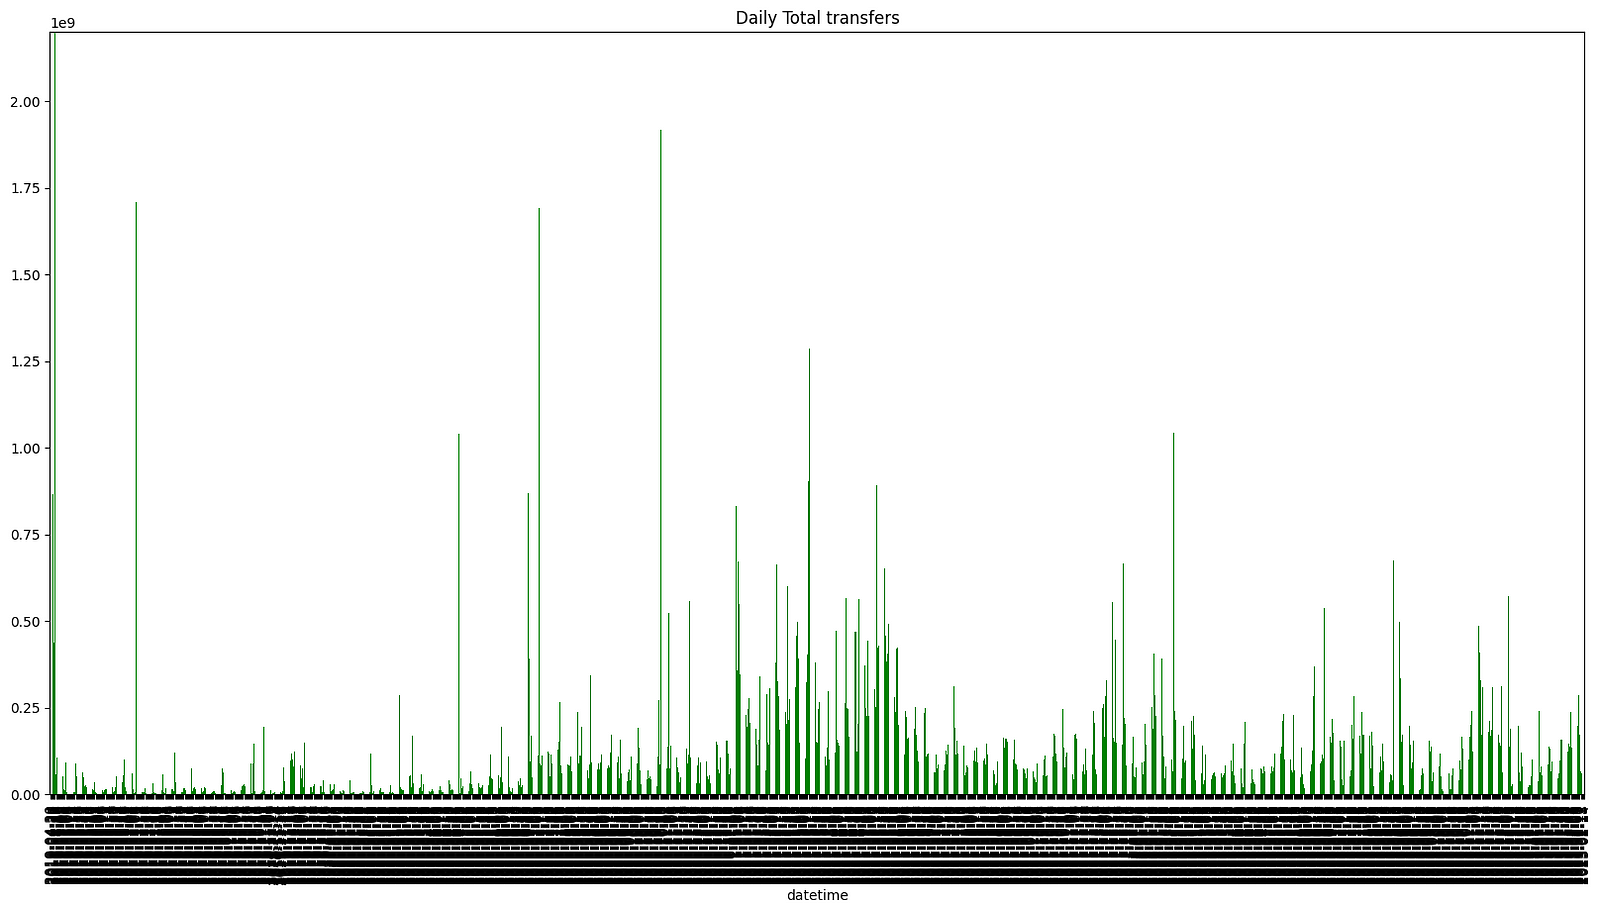
Then I wanted to play around with the data, with some basic aggregation. I thought it would be interesting to calculate the total amount of tokens transferred each day, for example.
Finally, I plotted this data, because visualizing it is always useful. Here is the code I used:
import pandas as pd
from pathlib import Path
import matplotlib.pyplot as plt

df = pd.concat(map(lambda csv_file: pd.read_csv(csv_file, index_col=None, header=None, names=[
               "block number", "timestamp", "contract address", "from", "to", "value"]), Path(r'./').rglob('*.csv')), axis=0, ignore_index=True)

df['datetime'] = pd.to_datetime(df['timestamp'])

df.sort_values(["timestamp", "from", "value"], inplace=True)

sumDf = df.groupby(df.datetime.dt.date)['value'].sum()

plt.figure().set_figwidth(20)
plt.figure().set_figheight(10)
sumDf.plot(kind = 'bar',
        x = 0,
        y = 1,
        color = 'green',
        title='Daily Total transfers',
        ylim=(0,2200000000.0)
        )

# show the plot
plt.show()
You can find this code in the analysis.py file in the GitHub repository. I have also created a Jupyter Notebook, for those who prefer using it (the script's virtual environment and dependencies are managed using Poetry).
Here is an example of the result:
Conclusions
The purpose of this project was to demonstrate how to use Subsquid’s indexing framework for data analytics prototyping.
I chose to index MATIC transactions on Ethereum mainnet, because it provides enough data to be significant, both in terms of performance and from a data analysis standpoint.
The indexer was able to ingest all this data, process it, and dump it on local CSV files in roughly 20 minutes.
I have then developed a simple Python script to demonstrate how to import these CSVs into a Pandas DataFrame, and perform aggregation operations on this data.
The final idea behind this kind of article was to collect feedback on this new tool that Subsquid has made available for the developer community, so if you want to express an opinion, or have suggestions, feel free to reach out.
I want to see more projects like this one, follow me on social media, and most importantly, Subsquid.
Subsquid socials: Website | Twitter | Discord | LinkedIn | Telegram | GitHub | YouTube


